The more BTC is used, the higher the transaction fees

Introduction

Bitcoin is the first peer-to-peer cryptocurency and was released in 2009. Bitcoin allows pseudoanonymous users to send and receive transactions. Transactions are confirmed by distributed participants with imperfect information called miners who may join and leave the network at will. Miners are paid transaction fees by users for their efforts. Miners collect transactions into structured blocks. The Bitcoin protocol includes a limit on the size of blocks that was added in 2010 to prevent spam attacks. The ideal size of the block size limit was hotly debated in 2016 and 2017 as the average size of blocks relentlessly approached the block size limit. With block space limited, users had to pay increasingly large transaction fees to incentive miners to prioritize their transaction over all others. Debate reached a fever pitch in mid 2017 and resulted in a blockchain fork and two versions of the chain, BTC (Bitcoin SegWit) which kept the 1MB block size limit but changed the accounting used to calculate that size (resulting in blocks having a “weight limit”) and BCH (Bitcoin Cash) which simply raised the block size limit to 8 MB. We now have 6 years worth of data with which to explore differences and tradeoffs between these two paths. I hypothesize that the more BTC is used the higher transaction fees will be.

There are really three key time frames here. Bitcoin from 2009 until the fork, BTC after the fork, and BCH after the fork. Figure 1 is a graph of the Mean Transaction Fees in US Dollars plotted against the number of daily Active Addresses. Both measures are taken from the on-chain data. The number of Active Addresses is a proxy for the number of unique users. BCH clearly has no relationship between the number of people using the network on a given day and the transaction fees on the same day (green points). Bitcoin and BTC have a relationship between the number of active users and the fees they pay. However, the broader market conditions are different between these two time frames. Bitcoin from 2009-2017 was an unconstrained network in a growing market. The USD exchange rate was first established then increased rapidly. Block size was increasing as more users joined the network and participated in economic activity. Only toward the end of that window did Bitcoin begin to feel the block size limit.

BTC from 2017-2023 is a constrained network in a mature market. The transaction throughput is limited by the limited 1MB block size. This in turn naturally limits the number of active addresses. Transaction fees (the cost to get a transaction in a block) regularly spike as more users than the network can handle would like to transact on the chain at the same time.

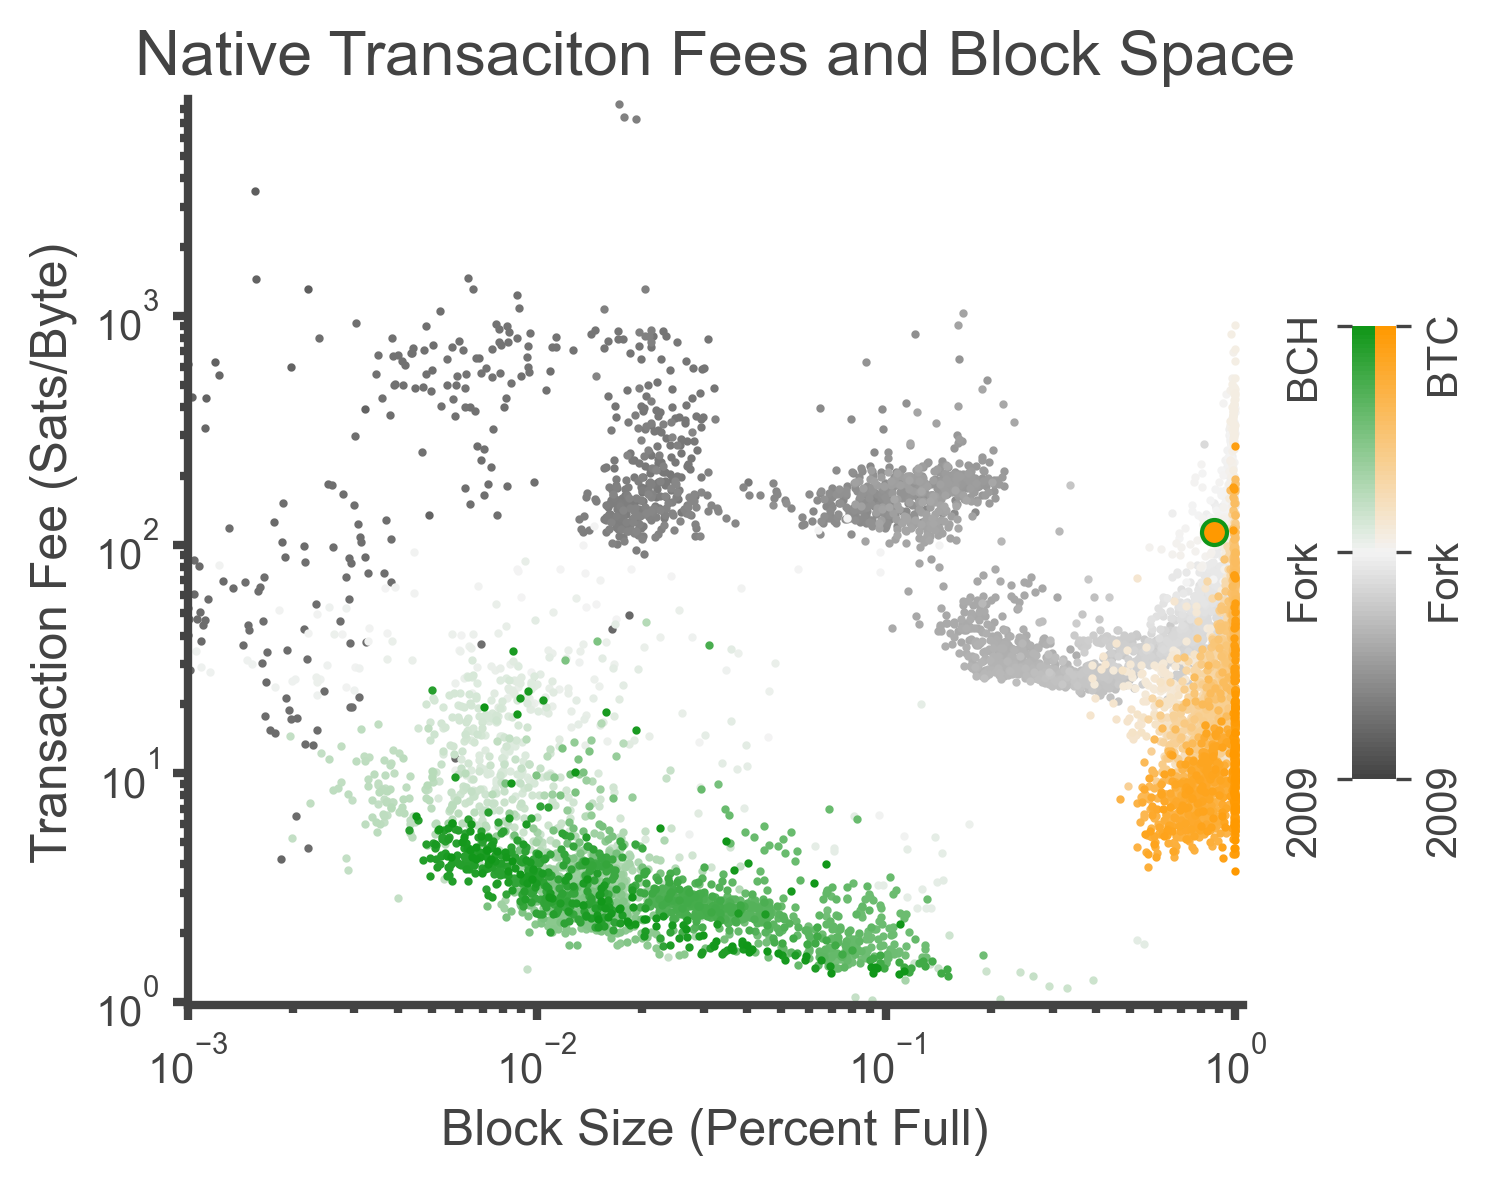
BCH from 2017-2023 is an unconstrained network in a mature market. Block sizes are around 1% of the hard limit of 32MB and still significantly lower than the 8MB soft limits set by many miners. The number of users and corresponding transaction fees are around or below those of Bitcoin in its early years.

Figure 1

Both transaction fees (Figure 2) and the number of active addresses (Figure 3) have strong general trends that span multiple orders of magnitude. Both have generally increased from 2011 until the fork. After the fork both are relatively flat, likely due to the constrained block size. On these graphs the gray line is the raw data, the colored lines are windowed averages where the windows range from 2 days (purple) to 90 days (red), and the dashed gray vertical line is the date of the fork.

Figure 2

Figure 3

Results

Prior to the fork, Bitcoin transaction fees and active users did not have a strong leading or lagging relationship (Figure 4). On the cross-correlation graph below between the Mean Transaction Fee noise and the Active Addresses noise the peaks for correlation at various window sizes (2-180 days, purple to red respectively) are marked with gray points outlined in the color of the window size. The peaks at larger window sizes are at a lag of -1, indicating that Mean Transaction Fees lead the number of Active Addresses by one day. The peak at smaller window sizes are at a lag of +387 but are not a strong prominent peak.

Figure 4

For post-fork BTC, the number of daily active addresses leads the transaction fees by 7-14 days (gray points with colored outlines) depending on the window size of the general trend, again from 2-180 days, purple to red respectively (Figure 5). This means that spikes in the transaction fees are forecasted by spikes in the number of users. As the number of users grows close to the limit, transaction fees spike. This behavior is not observed in post-fork BCH data and is thus not a result of the maturing, broader cryptocurrency market. The BCH network is not constrained by the block size and the cost to use the network (transaction fees) is not dependent upon the number of people trying to use the network.

There is also an interesting, strong, weekly periodicity in the cross-correlation at all window sizes.
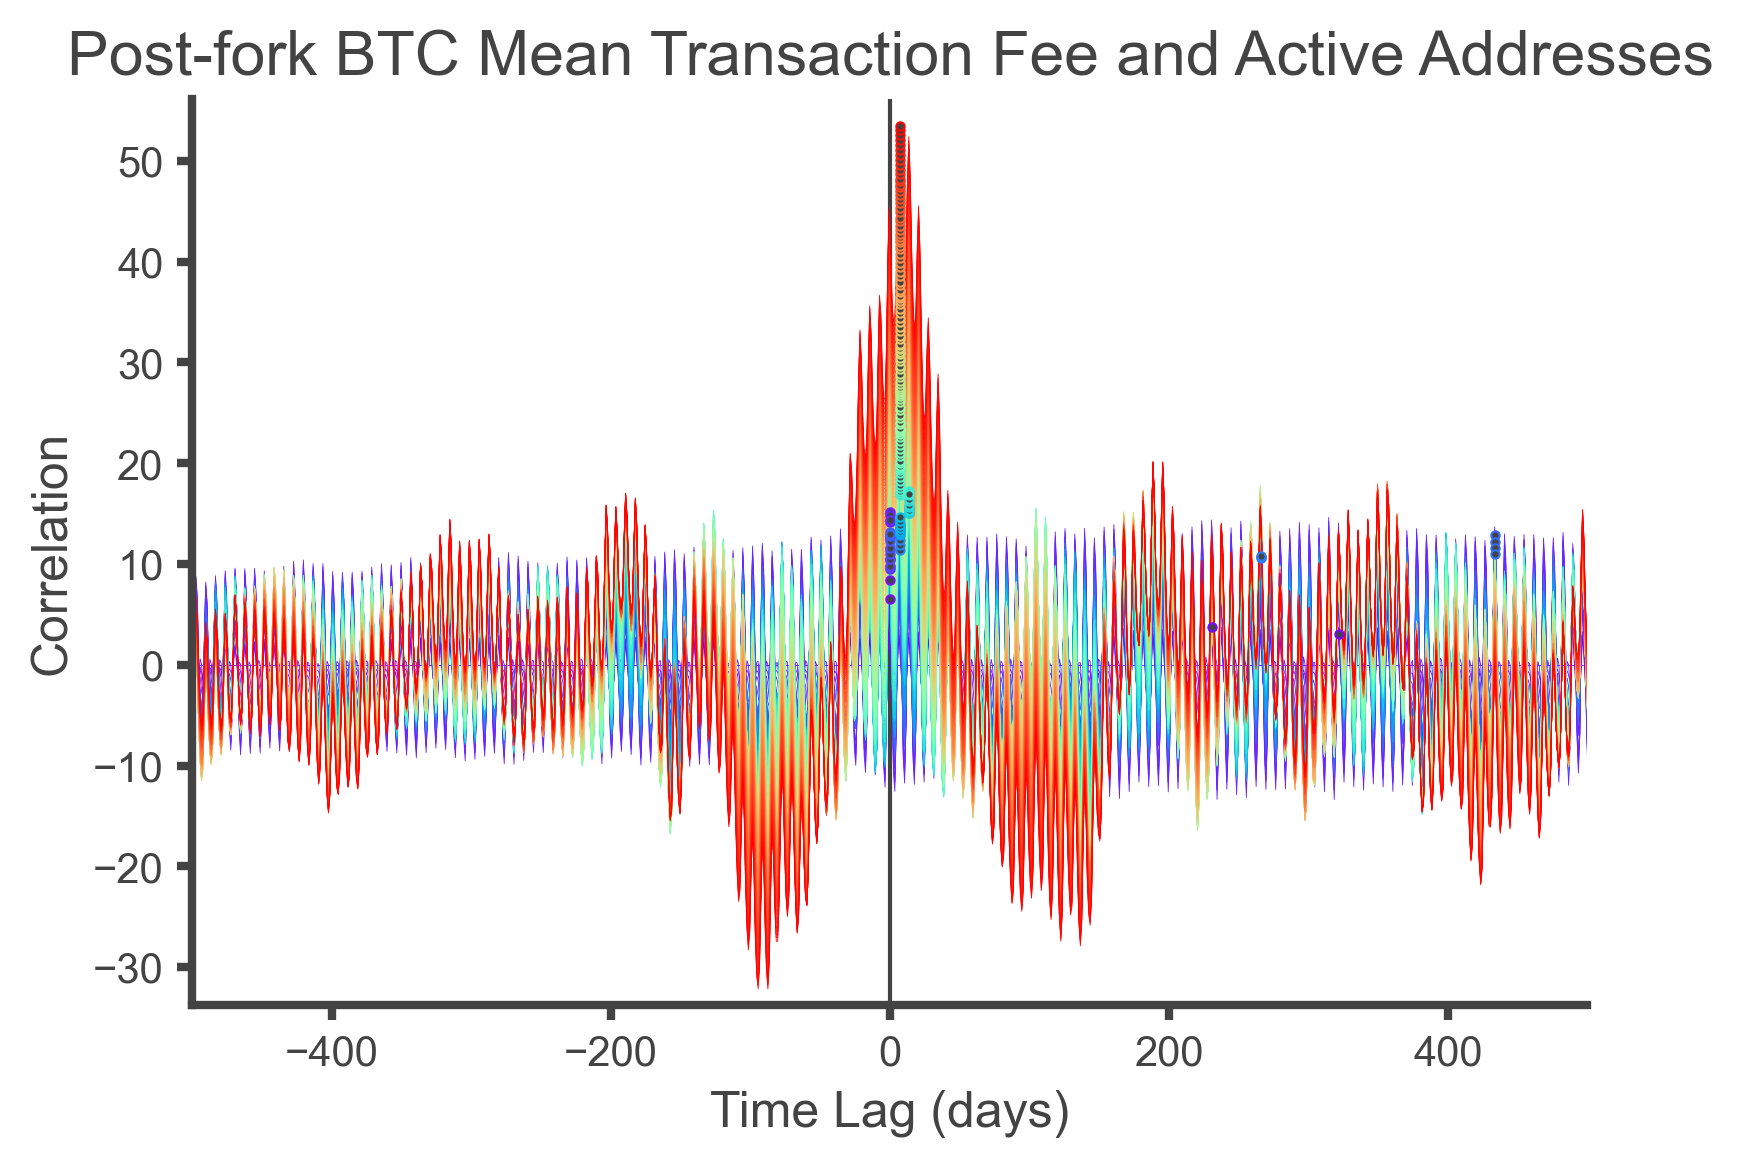
Figure 5

Discussion

Here I have first looked at the static relationship between the number of users on the Bitcoin, BTC, and BCH networks and the fees those users pay (Figure 1). This static viewpoint spans 15 years of daily data and shows that Bitcoin and BTC have a strong relationship between the number of users using the network and the fees those users pay. In contrast, the BCH network does not show such a relationship. This result is to be expected as the Bitcoin network underwent natural growth from 2009-2017 where more users downloaded wallets and made transactions. At the same time, the Bitcoin/fiat exchange rate increased greatly. Transaction Fees paid by users were not a main concern for many years. From 2017-2023 the BTC network has been constrained by the block size limit which limits the number of transactions the network can process and thus the number of users that can use the network. This in turn drives up transaction fees that users must pay as they are forced to bid against each other and the richest users buy the privilege to have their transactions processed. In contrast, the BCH block size is kept well above the current size of blocks so users enjoy much lower transaction fees even when many users want to simultaneously use the network.

From this static view of the data it is unclear how the number of active addresses and transaction fees are related, so I next isolated the noise in each signal to understand their temporal relationship. It is important to look at the noise in the signals as both general trends strongly increase over the time frame. If the two signals were uncorrelated then it would be expected that the noise in one has no correlation with the noise in the other. If however there is a temporal relationship between the two signals then a spike in activity in one would lead to a spike in activity on the other signal. The third option is that there is a third, hidden variable that causes a spike in activity in both variables but at different times. This option is not refuted by the data presented and analyzed here, but would require a more complicated explanation of the system. Using noise to establish causation was inspired by this paper, Climenhaga, Nevin, Lane DesAutels, and Grant Ramsey. "Causal inference from noise." Noûs 55, no. 1 (2021): 152-170, but I did not use their method.

The windowed average was used as the general trend of the data. The window size was varied from 2-180 days to capture a range of noise or deviations. The windowed averages were subtracted from the raw data to get the noise data. Finally, this noise data was normalized to the general trend at each day to avoid biasing the analysis to larger values. These normalized noise signals were cross-correlated. Neither, pre-fork Bitcoin nor BCH have a temporal relationship between the number of users and the fees they pay (Figure 4). BTC however does show a strong temporal component as the number of users leads the transactions they pay by 7-14 days (Figure 5). This strong evidence shows that the more BTC is used the higher the transaction fees that users are forced to use.

One flaw unique to BTC is that the more people use the network the more costly it becomes. BTC has limited their block size to an arbitrary 1 MB which limits the throughput of the network. Why not have a 300 kB block size? Or a 2 MB block size? Only a limited number of transactions can be processed and only a limited number of users can use the network. The behavior of the BTC network whereby an increase in the number of users leads to an increase in the fees the users must pay is antithetical to a well functioning currency or market. The strength of networks (currencies, marketplaces, social networks, countries, etc.) is proportional to their size and connectedness. This fact has been true throughout human history. Designing a network that becomes more expensive and less useful as more people use it undermines the foundation of the network.

Method

Data were downloaded on October 27, 2023 from CoinMetrics.io. Data are daily averages for each metric. Data were processed and plotted in python 3.11.5 using Anaconda, Spyder, Matplotlib, Numpy, and Pandas.

Both the Transaction Fees and the Number of Active Addresses have strong general trends that span many orders of magnitude (Figures 6 & 7). Further the general trends are not well approximated by simple functions which is to be expected by such a complex system. Thus I’ve used windowed averages to approximate the general trend. The window sizes ranged from 2-90 days. At each time point, the general trend of that particular window size was subtracted from the raw data. This difference was then divided by the general trend to get the noise as a percentage of the general trend (Figurs 8 & 9). This is important as the data span many orders of magnitude. Finally, the isolated noise signals from both the Mean Transaction Fees and the number of Active Addresses were cross correlated. The two noise signals were autocorrelated to look for any signs of autocorrelation which would interfere with the interpretation of the cross correlation. No signs of autocorrelation were found in either signal (Figures 10 & 11).

The windowed averages for Transaction Fees, Fk(t), and Active Addresses, A_k(t), were calculated with the equations below and indexed by the window size, k. The raw signals of the transaciton fees and active addresses were f(t) and a(t), respectively.

FIgure 6

Figure 7

The noise in the transaction fees, N_{F_k}(t), and active addresses, N_{Ak}(t), were calculated with the equations below and were indexed by the window size, k.

Figure 8

Figure 9

Finally, the two noise signals were cross-correlated with the equation below.

Figure 10

Figure 11

Bitcoin Block Size Limit Impacts Transaction Fees

Introduction

Bitcoin is the first peer-to-peer cryptocurency released in 2009. Bitcoin allows anonymous participants to send transactions. Transactions are confirmed by anonymous participants called miners. Miners are paid transaction fees for their efforts. Miners collect transactions into structured blocks. The Bitcoin protocol includes a limit on the size of blocks to prevent spam attacks. The ideal size of the block size was hotly debated in 2016 and 2017 as the average size of blocks relentlessly approached the block size limit. Debate reached a fever pitch in mid 2017 and resulted in a blockchain fork and two versions of the chain, BTC (Bitcoin SegWit) which kept the 1MB block size limit but changed the accounting used to calculate that size (resulting in blocks having a “weight”) and BCH (Bitcoin Cash) which simply raised the block size limit to 8 MB. We now have 6 years worth of data with which to explore differences and tradeoffs between these two paths. I hypothesize that as BTC is used, block sizes will perpetually be around the block size limit and as a result fees will remain perpetually high which will impair its ability to be used as a peer-to-peer electronic currency.

Figure 1

Figure 2

The USD/BTC exchange rate has dramatically risen six orders of magnitude (Figure 1) since the currencies began being exchanged. After the Bitcoin fork, BCH fell about one order of magnitude. In the years leading up to the fork, Bitcoin’s block size steadily increased until it ran into the hard limit (Figure 2). After the fork, BTC block sizes increased slightly as SegWit adjusted how block sizes are measured. If all transactions in a BTC block are SegWit transactions then the block will be 2.3 MB, a modest increase. BCH blocks are generally smaller than BTC blocks but are able to be much larger than BTC blocks without causing a corresponding spike in transaction fees.


Results

Transaction fees dramatically rose from 5 cents during 2013-2016 to $1 during the Bitcoin blockchain fork on August 1, 2017 (Figure 3). Fees on BCH quickly fell to 1 cent and settled at 0.1 cents in 1.5 years while fees on BTC continued to rise, spiking to $30 before continuing to dramatically oscillate between 10 cents and $30. Fees on BCH have remained around or below 0.1 cents. While fees on BTC occasionally remain below $1 they rise above for days to months at a time. Regardless of any temporary spikes in fees, the long-term approaches taken by each fork are clearly evident. BTC fees remain high while BCH fees remain low.

Figure 3

On Bitcoin and BTC chains there is a strong relationship between the median transaction fees and the block size, particularly when blocks are nearly full (Figure 4). Spikes in BTC fees are strongly related to how large blocks are relative to the block size limit. Post fork, BTC blocks have remained >50% full while BCH blocks vary between 0.5-10% full.

Figure 4

High transaction fees generally seem to also have a secondary influence on the value of transactions (Figure 5). If transaction fees rise too high then small transactions are rendered infeasible. Users will either wait for fees to decrease or use a competing value transfer network (USD, Venmo, etc.). These data are confounded by nonfinancial applications of blockchains, e.g. NFTs or ordinals, which require on-chain transactions to establish ownership of digital assets but whose transaction value is is unrelated to the digital asset. Even still, generally BTC transactions are ~$100 while blocks are nearly full while BCH transactions are unrelated to block size. BCH transactions are between 0.5 cents and $10, comparable to Bitcion transactions prior to the fork.

Figure 5

Analyzing the fees is challenges because the USD exchange rate of BTC has changes so dramatically over the years (Figure 1). Aside from hashing, the real costs associated with mining relate to the amount of data they have to process and store, not the number of transactions they process. Transactions are not all the same amount of data. Thus, transaction fees are not priced per transaction but instead per byte. The minimum transaction fee is really 1 sat/byte and transactions are typically around 250 bytes. So, when comparing transactions on BTC where the exchange rate is $30,000 USD and BCH where the exchange rate is $250 USD, the minimum average total transaction fee on BTC is around 7.5 cents while on BCH it is 0.0625 cents. Though most people still understand transaction fees in terms of USD (as neither BTC nor BCH are units of account), a fair comparison of the capabilities of the underlying protocols would compel us to compare the transaction fees on a sats/byte level. Transaction fees have steadily decreased since the creation of Bitcoin (Figure 6). BCH fees remain below BTC fees by about 2-3x while BTC fees have dramatic increases during times of high chain usage.

Figure 6

Figure 7

While transaction fees measured in sats/byte are more similar between BCH and BTC than fees measured in USD fees, they still spike when blocks fill up (Figure 7). When blocks are continually full for weeks Bitcoin users may either wait for fees to fall or they may try to outbid all other users. This limits the usefulness of BTC as a currency.


Discussion

The success of cryptocurrencies as peer-to-peer electronic currencies is an important topic. Here I have begun looking at the relationship between the block size limit and transaction fees using real world data from both the BTC and BCH blockchains over the past 6 years. Transaction fees in USD (the current unit of account) are consistently three orders of magnitude smaller on BCH than BTC. There is a strong, clear relationship between blocks approaching the block size limit and fees increasing. This has the secondary effect of only making larger value transactions viable. Though some of the higher fees are due to the large price difference between the forked chains, fees priced in native tokens are still higher on BTC than BCH and still spike when block approach the size limit. This reflects the philosophy of the two communities, BCH is committed to keeping fees low while BTC is committed to ossifying the protocol at the expense of usability. As hypothesized, perpetually full BTC blocks result in perpetually high BTC fees that periodically spike which results in only high value transactions being viable and thus limits BTC’s usefulness as a peer-to-peer electronic currency.

Method

Data were downloaded on October 27, 2023 from CoinMetrics.io. Data are daily averages for each metric. Data were processed and plotted in python 3.11.5 using Anaconda, Spyder, Matplotlib, Numpy, and Pandas.

CoinMetric’s database does not include transaction fees measured as satoshi/byte. Instead I’ve taken the the daily total fees in native tokens ("FeeTotNtv”) and divided by the daily total size of blocks mined in bytes (“BlkSizeMeanByte” * ”BlkCnt” * 1,000,000).

Block Size (Percent Full) was calculated. Block sizes (“BlkSizeMeanByte”) prior to the Fork were divided by 1,000,000 as the maximum block size limit was 1MB. After the fork, BTC’s maximum block size is instead measured as a block weight (“BlkWghtMean”) which is divided by 4,000,000 (the maximum block weight). BCH block sizes after the fork ("BlkSizeMeanByte”) were divided by 8,000,000 as most miners have a soft 8MB block size limit.

Bottle Terrarium Update

My bottle terrariums are still growing strong! I washed the outsides of the bottles, added a little Osmocote fertilizer, and watered the plants.

I am continually on the search for new plants that grow well in the limited conditions: little water, high humidity, and scare nutrients. So far, only the Silvery Ann / Satin Pothos grows well in the challenging conditions. Today, I tried adding Swiss Cheese Plant and Tradescantia ‘Rainbow Zebra’ to old bottles whose plants had died. I hope they grow well!

The last time I really cleaned the bottles was in 2020, and two years before then. Three of the bottles, No. 209, Bulleit Bourbon, and the white label wine bottle have been growing for six year now!

Bonsai Terrariums

Today I cleaned and watered my bottle terrariums. The last time I did this was two years ago. Three of the bottles, No. 209, Bulleit Bourbon, and the white label wine bottle have been growing for four years. With such limited soil, air, light, and nutrients the plants only slowly grow. They might need some high nutrient input such as compost or compost tea in the future.

This year I added a few new terrariums made with pretty bottles I’ve collected. I especially like the St. Germain bottle and the champagne bottle on the right.

Nefertiti ring

This Nefertiti ring is made using a high quality scan of the Nefertiti bust on display in the Neues Museum. According to artists Nora Al-Badri and Jan Nikolai Nelles, the OBJ file was captured by scanning the bust on display in the Neues Museum. This raised some suspicions due to the submillimeter accuracy of the scan (through a glass case) and the fact that the bust was professionally scanned by TrigonArt in 2008. It seems more likely that the file from this professional scan was leaked. Either way, the 3D scan was released to the public as a way to make "cultural objects publicly accessible." With the release of the scan anyone can print it or remix it, begging the question of which will be more important going forward, the original or the scan? 

CT scans show Thutmose, the sculptor of the bust 3363 years ago, covered up wrinkles and bags under the eyes, possibly in an attempt to conform to the "aesthetic ideals of the era" (ancient photoshop?). The original bust is not an accurate representation of the woman Nefertiti and is thus and early second-order simulacrum, "symbol of a non faithful representation to the original." 

Jean Baudrillard references Jorge Luis Borges' short story On Exactitude in Science where a kingdom is so obsessed with making an exact map of the kingdom people become more invested in the representation as original decays. The kingdom falls to ruin and people eventually live in the tattered remains of the map. (Basically, the Matrix where everyone lives in a simulation while the real earth is destroyed).

Over time the original bust will degrade (and perhaps be destroyed) while the scan lives on as a perfect replica, a reverse of the events in The Picture of Dorian Gray where the picture ages instead of Dorian Gray. At this point the scan and prints made with it will become a third-order simulacrum, when the "symbol is taken to be more important or authoritative of the original." 

Similarly, we could digitally restore or touch up the scan of the bust. The stucco has cracked and flaked in a few areas, and her left eye is missing. Fixing these is small, but fixing more ornamental parts of the bust, like the cobra on her crown would make the scan more of a third-order simulacrum, a symbol with no original. We would run the risk of adding ornamentation that looks vaguely "Egyptian." This could result in a situation like the one in the Doctor Who episode The Magicians Apprentice, where the Doctor rides into a theater in 1138 on a modern tank with an electric guitar. The juxtaposition of such items is clear to us, but to someone from the far future these items are all from a close enough time period. The same could happen if we try to improve the Nefertiti bust. If we add a cobra that looks "Egyptian" the style could be off by decades and the scan of the bust will have become a third-order simulacrum.

The original scan is a 71.8 MB file with 2,018,232 facets. Because the ring is small I reduced the number of facets to about 25,000. I joined the bust to an octagonal ring with AutoDesk's TinkerCAD and printed the design in steel from shapeways. It is available in my store.

Espresso

This is a demitasse 3D printed out of porcelain. The outside has a cubic/pixelated/voxel pattern around the cup which contrasts well with the smooth, hemispheric cup.

I designed this espresso cup just to try out 3D printing with porcelain. The piece is not actually directly 3D printed, but instead a cast is 3D printed by laser sintering. It is then filled with porcelain and fired. Even though this model was molded there is no visible seam from the mold! 

The best thing about designing with porcelain is that it is food safe and can be washed. 

It is available here.

Transistor


This ring is based on the weapon in the video game Transistor. It has a computer circuitry look to it. I designed this ring in 123D by Autocad. I had it printed in gold plated stainless steel to maintain the circuitry feel. It is quite top-heavy and the hole is slightly too big for my finger, so it doesn't stay perpendicular to my finger as I would like. Overall, I am very happy with the unique design and circuitry feel. It is available on Shapeways.


Whitehouse

My sister set up and ran a creative Minecraft server for a while.  She built this whitehouse at the spawn site.  I captured this model and had it printed before she shut down the server as a way to remember it.

The flag and tree are fragile (at least in sandstone) because they are only connected by a single Minecraft block.  Otherwise, the full color model is beautiful.

I used Mineways to capture the volume I wanted to print. It is easy to use. The world save is opened in a top down view, and you just select the volume to print. The Minecraft world save is converted into an stl file, ready to be sliced and printed. I found this method through erich666's L'Effie, Vokselia's Eiffel Tower and Mauricio's October 27th, 2010 blog post

This was my first 3D model, and the easiest to make. As a CAD program, Minecraft is very intuitive.

Ring

This ring was created with ShapeJS, a programming language made by Shapeways. The ring is the combination of two bands. The inner band (size 9.5 19.4 mm diameter) is 1.5 mm thick and provides a smooth surface. The outer band is made by intersecting a SchwarzD Minimal Surface with the outer band, a ring. As before, minimal surfaces are the minimal surface needed to connect given boundary conditions (like soap bubbles forming inside a ring of wire or a circus tent draped on poles. Here the minimal surface provides a quick way to make an interesting pattern. After the intersection, the corners are rounded. Currently the minimum feature size is 1mm thick, so sharp corners or very thin features need to be smoothed out for printing. To help with printing I made the SchwarzD pattern very thin with a larger period. It is not easy to get a sense of the minimal surface from the final ring design, but the pattern it produces is interesting. It reminds me of waves in sand. Here is a link to the ShapeJS minimal surface ring example.

SchwarzD ring is now available on my Shapeways store.

Terrariums

Bottles, especially bottles of alcohol, are all so beautiful and uniquely shaped. I hate just recycling them when they're empty, but keeping keeping empty bottles seems like a waste of space. I also love plants, but watering them can become a chore.  So, I've taken interesting old bottles and filled them with plants.  This way I can keep the bottles, and the plants need watering less often.

So far, 750 mL bottles are a good size. They are 1/3 full of dirt and 2/3 open for the plant to grow. Each terrarium has coarse alabaster in the bottom to help drain the soil above.  Between the marble and soil is activated charcoal to help limit mold and fungi growth and release nutrients to the plants. The terrariums are left open, but with such narrow necks they stay quite damp. Plants that do well in these conditions require nearly continuous moisture. Some plants I've tried just end up dying. At first I tried sealing the bottles, but the plants quickly died. The plants in the sealed terrariums may have been too large for the container. This would cause them to use up limited nutrients before reaching equilibrium in the system. Interestingly, a similar result was seen at a much smaller scale when confining populations of cells. Chambers with few initial cells grew while chambers with many initial cells did not grow.

Slow groing plants work better. Fast growing plants tend to grow out of the neck of the bottles. Finally, they should be left to grow in bright rooms but never direct sunlight. Direct sunlight will cause the terrarium to act like a car on a hot day and cook the plant inside. 

Sharkfin

On a family vacation at Hilton Head, South Carolina about 10 years ago I bought a bottle opener just like this one. My dad wanted one too, but unfortunately it was the last one in the store and the island.  This is a perfect, almost stereotypical, scenario requiring 3D printing: the need for replicating a unique object.  It also seemed like a good beginner CAD project, so I set out to have one printed for my dad. I started with a rectangular block and took the intersection of a projected shape in all three dimensions. The fin shape was drawn by hand as a spline. The other two dimensions were an isosceles triangle (projected from the back to the front) and an oval (projected from the bottom to the top). I uploaded the STL model and had it printed in stainless steel. Now, thanks to 3D printing, a once rare object is available to anyone.

When I first got it I was worried it would break, but I've opened bottles with it no problem. The fin shape of this one is a little different from the one I was replicating because I drew it by hand. The tip of the fin is thicker than the original because of printing limitations, but no worries it still looks amazing.  Finally, the striped pattern comes from the layer resolution of the 3D printer.  I think it looks cool because it clearly sets the bottle opener apart as being 3D printed. I gave it to my dad, and he loves it! 

PhD beyond Academia

Knowing is not enough; we must apply. Willing is not enough; we must do.
— Johann Wolfgang von Goethe

Driven by the shortage of positions in academia, the purpose of the university is changing, and only a few programs are reacting.  PhDs, the highest academic degree, were traditionally for people aspiring to be professors in much the same way as medicine and law degrees are for doctors and lawyers.  However, due to an over abundance of new PhDs, programs need to adapt.

Oxford lists the purpose of a PhD as, "It is no longer just about producing an original piece of excellent research; producing a trained researcher is an equally important output. (Mary Ritter, Pro-Rector for Postgraduate Affairs at Imperial College, London and Chair of the UK GRAD Steering Group, Research Councils UK)." In some cases this is taken further to training someone suited for business, political science, or industry.

There is a crisis in academia.  As Jake Beal tweeted, only 8% of current PhD students will every land a tenure-track faculty position.  Furthermore, those 8% are likely to only come from the top schools.  PhDs are instead turning to entrepreneurship, data science, and policy.  So, how should PhD students use their degree, and how should they position themselves to succeed post graduation?

Programs like the Bredesen Center are adapting PhDs for entrepreneurship & policy, prior to graduation. The Bredesen Center is a PhD program that exists outside traditional disciplines.  Each student studies an aspect of energy.  I study what conditions affect noise in genetic circuits, but other students study everything from hydropower to plasma physics.  As part of the program we are required to take a few courses in either entrepreneurship or policy, and we are encouraged to go beyond the classroom.  This model is important for modern PhD students; learning skills outside science is important to prepare scientists for jobs outside academia.  Other programs offer post-doc short courses for turning PhDs into data scientists.  

In the spirit of the meritocratic hacker ethic, real, concrete projects are superseding credentials.  A PhD and entrepreneurship are examples of such projects.  Alex Shye discusses a few similarities between the two including experimentation, moving fast, understanding the current field of work, and unstructured work that permeates your life.  Even companies are no longer as concerned that candidates have checked all the boxes (e.g. which degrees, from where, working for whom).  They now want to see portfolios of projects candidates have completed; work can be shared directly with the world (the purpose of this website).  Professor Christine Ortiz, the dean of graduate education at MIT recently stepped down from her position to found a new type of university focused on projects, not lectures, majors, or exams.  The Thiel Fellowship goes a step further and offers driven teenagers the stability and opportunity to build their own venture (startup, non-profit) instead of attending college.  One of the driving ideas is that experience completing projects is more valuable than sitting through dictation in a classroom.  

The Bredesen Center model is working.  Justin Knowles and other students have received national recognition for their work on clean energy policy.  Tony Bova is replacing oil-based plastics with bioplastics.  Beth Papanek and I are creating a low-cost biological source of nanoparticles.  Three teams of students, including Adeola Adediran, Christine Ajinjeru, Akinola Oyedele, and Eva Mutunga, have won the local pitch competition Vol-Court.  

The future is bright.  Forget knowing and willing.  Apply and do.  Make.

Complexity

The picture on the left is an egg in a 3D printed voronoi coquetier, or eggcup.  At least on the surface, complexity seems reversed from what is typical.  That is the inorganic eggcup has a much more complex structure that the simple curved biological egg.  In contrast, the varied structures of the succulents to the right are more complex than the plain pot they're in.

While complexity between the egg and eggcup at the macroscopic scale is reversed, the minimalism of the egg hides far more complex nanostructure than the eggcup.  The egg has the potential to make a quite radical transformation into a bird with many types of tissue displaying varied structures.

Interestingly, biology and 3D printing are starting to merge and create objects that are complex across many scales.  Biobots makes printers that create biocompatible scaffolds that support cell cultures and grow organs.

The coquetier was designed by @Gregoware, downloaded from @thingiverse and printed on an @ultimaker.

Cured Ham

My friends ate a cured ham with Thanksgiving dinner a few weeks ago.  They thought something like mold or fungus was growing on the outside.  I thought it was just salt, but I collected some into an eppendorf tube to look at later.  I went home for Thanksgiving and my friends stayed and cooked the ham.  They first washed the outside (removing what we though was salt or mold) and then soaked the entire leg in water for a day.  This was to draw out the salt that was used to cure the ham.  They then cooked it in the oven and enjoyed it.

About two weeks went by until I could look at the sample under the microscope.  By the time I put the sample on a microscope slide it had collected moisture and was much wetter than when I collected the sample.  

First, I scraped some of the sample on a number 1 coverslip, and mounted it on an inverted Nikon microscope with a 20x air objective (the 100um scale bar applies to all images).  At first I saw dried salt crystals.  As I looked at the sample it was drying out.  I switched from backlit to fluorescence, and some of the crystals were fluorescent!  They lit up the crystals around them.  The center and right images are in the same location, but the center image is fluorescent while the right is backlit.  Fluorescence was excited at a peak of 532 nm (blue-green) and the emission peak was at 595 nm (yellow-green).

Then I saw this large shadow, and it was moving!  It looked like a large bug.  I recorded a video over about 7 seconds, imaging frames as fast as possible.  Just after the video was recorded it stopped moving, and I could not get a better image of the bug.  I think it was alive and either dried out or got cooked to death by the lamp illuminating the stage.  

After some searching, I learned cured meats can harbor pests, including mites.  They are about 800um long  (which this one appears to be), and they have eight legs, four in the front and four in the back, with little hairs growing off the legs.  These live on the outside of the meat only and can be easily washed off.  This was a learning experience.  I don't think the mites were harmful, but they do look gross.

Bitcoin

Bitcoin (BTC), the cryptocurrency, is supported by a network of independent miners and is always mining blocks.  Each block is a challenging computational problem, and the difficulty is adjusted based on the computational power of the entire network so that one block is mined every 10 minutes. The computer that mines the block (solves the problem) collects the transaction fees associated from any transactions processed in that block and, currently, 25 new BTC.  So, given we can estimate the reward for mining a block (in BTC) and the amount of electricity the network spend mining the block, can we quantify the value of BTC in dollars (USD)?

Fundamentally, the value of BTC should be greater than or equal to the energy cost needed to keep the network running.  If miners receive less value from the BTC they earn than from the electricity they put into mining they will leave the network, and the average amount of BTC each remaining miner receives will increase.  If the value of BTC is excessively high compared to the electricity input miners will enter the network and the average amount of BTC each miner receives will decrease.  The decision to enter or leave the market is unique for each miner, but we assume the long run average value of BTC in dollars is greater than or equal to the cost of mining.  So mathematically,

(transaction fees + new BTC) = cost of electricity * energy input

The left hand side of the equation is the number of BTC per block.  We have already covered new BTC.  This amount of new BTC decreases by half every 4 years, and the last new BTC is expected to be awarded in 2140.  So why mine blocks when no more coins are being awarded?  When the block is mined, transactions are processed.  These are other people, not necessarily the miner, exchanging BTC.  If someone wants a transaction processed they attach a fee.  These fees are awarded to computer that mines the block.  In the long run individuals will only continue to mine if the reward, transaction fees, offsets the cost of mining, electricity costs.  We will ignore capital and overhead costs (e.g. taxes, cost of buildings, miners, and labor) to simplify the analysis, but including these will increase the lower bound of dollars per BTC.

The right hand side of the equation is the dollars spent mining each block and relies on electricity being priced in traditional fiat currencies.  A reasonable estimate for the average price of electricity across the network is $0.05/kWh.  This is slightly less than the world average because large scale BTC mining is done in cooler climates to ease cooling costs or areas with cheap electricity.  Energy input, like cost of electricity, is an average across the network.  The energy consumption per Gigahash is continuing to improve, but current ASIC miners are estimated to consume 5 Watts/(Gigahash/second), also here.  The size of the network, measured as hashrate, is readily available.  Below are the variables used with estimated values:

We rearrange the first equation to get dollars per BTC.  The 1/6 hour is assuming one block is mined every 10 minutes.  This is not always the case.

$/BTC = (<EC> * <Eff> * HRN * kW/W * 1/6) / (BTCtc * <TB> + BTCnew)

With the assumptions above, the equation predicts $830 for 1 BTC.  This is slightly above the current exchange rate of about $420.  Indicating that BTC is currently undervalued relative to the resources used to make those BTC (the amount of electricity used to make BTC is greater than the worth of those BTC when converted into USD).  The calculated exchange rate is quite sensitive to the average cost of electricity across the network and the average efficiency of the miners used.  If the cost of electricity is instead $0.01/kWh the exchange rate drops to about 1BTC=$166.  Similarly, if the miners are more efficient, say only 0.5 Watt/Gigahash, the exchange rate drops to only 1BTC=$83.  Other explanations for people paying more in electricity than the value they get include people mining for fun, as insurance against holding centralized currencies, or expecting the value of BTC to increase dramatically.  For example, after the next halving, expected in 2016, the reward of new BTC will drop to 12.5 per block, and the exchange rate predicted by the equation jumps to about $1,653.  In the extreme case, when new BTC are no longer released and the only reward for mining is transaction fees, the exchange rate predicted is 1BTC=$208,000 (assuming the cost of electricity, mining efficiency, number of transactions per block, and transaction fees are the same in 2140 as they are today, lol). With the new BTC rewarded at zero, the hashrate of the network would have to drop to only about 500,000 Gh/s, from the current 500,000,000 Gh/s, for the exchange rate to be about today’s rate.  

In the end, this was a fun exercise to put some numbers on the resources being put into BTC and compare those to the current value of BTC.  This analysis suggested BTC is currently undervalued, but in reality, BTC's value derives from many different sources including an alternative to restrictive currencies, purchasing drugs, or protection against inflationary policy.

Baymax

Big Hero 6 is an awesome Pixar movie from last year.  While the main plot follows superheroes fighting a villain, the beginning of the film really idolizes science and maker culture.  The main character, Hero Himada, uses homemade bots to win illegal robot fights in the streets of San Fransokyo (San Francisco / Tokyo mashup).  His older brother, Tadashi, is a student at university engineering a healthcare robot, Baymax.  The scene where Tadashi's lab is introduced is really cool, and in some ways captures the excitement of scientific (and engineering) research.

My sister helped me print RyanMark's Baymax model.  I chose this model because it is designed to not need supports.  Baymax is a difficult shape to print because both the top and bottom are rounded.  Additionally, his hands and fingers create an overhang.  This model is printed in two halves to avoid these problems.  This way each half is printed from a stable base and any small parts (fingers) are printed out from the main structure.  We printed Baymax at 20% fill to save materials.  Because the plastic we printed with is clear you can see the fill as crossed lines across Baymax's body.  After the print finished I used a toothpick to paint the eyes with Testors black enamel model paint (though liquid rubber would have worked well too).

Shade

"Complexity is free" is one of the popular saying about 3D printing.  It means that unlike traditional manufacturing, more complex shapes are just as easy to make as simple ones.  Biologically inspired shapes are a great way to show off "complexity is free."  I wanted to print a really cool, flowing, organic shape that was also functional, so I chose the Julia Vase #011 by virtox as the lamp shade.  My sister helped me print it out of a tough, clear plastic.  The model is hollow so the printer generally just traced the edges.  

Ideally the lamp would be self contained within the shade to avoid disrupting the unique, complex surface.  I decided on powering the lamp with induction coils for a sleek design.  In theory the lamp shade could be printed to completely enclose the lamp.  The lights need to be LEDs to avoid generating enough heat to melt the plastic and to fit inside the shade.  I followed this guide by Tyler Cooper on Adafruit to get the parts list and get the wiring right.  All parts were ordered from Adafruit.  The circuit is really simple.  The wall plug is soldered to the coil supplying power.  The coil receiving power is soldered to a resistor (to avoid overloading the LEDs) and a few LEDs in parallel.  

There are a few things could be changed.  The LEDs are a little dimmer than I expected.  I think this is because of the resistor I used (1kOhm).  If it has less resistance there would be more current and brightness.  The LEDs light up around 3cm above the coil.  Again, if the resistor were smaller it would probably light up further from the coil.  Finally, the transmitting coil is bare, so I'll need to make a small case for it (and a stand for the shade).  Overall I am really happy with the result.  The lamp shade is especially beautiful when lit from the inside.


Cell-free Scalability

Biotechnology has so far relied on microbes.  They produce beer, bread, cheese, yogurt, insulin, chemicals, flavors (like vanillin), and many other products.  Some of these microbes were found naturally and others were altered with metabolic engineering.  The output of a product from engineered microbes generally depends on the scale of the reaction.  On the lab scale, microbes may show high concentrations but when the bioreactor is scaled to industrial levels the concentrations drop.  This presents a major challenge for researchers engineering microbes.  Their lab scale microbes perform wonderfully but commercialization fails.  Cell-free synthetic biology is becoming an alternative to metabolic engineering.  Cell-free reactions only use parts of cells to carry out reactions, so nothing needs to be kept alive.  Additionally, the only reactions happening in the system are those that contribute to the desired product (when using cells many reactions are necessary to just keep the cells alive).  Cell-free reactions are easier to manipulate and quicker to run.  Fortunately they are also scale independent.

 Zawada et al. tested the scalability of cell-free reactions for cytokine production.  The plot to the right shows their main finding.  Concentrations of products are plotted versus time.  The different curves represent different scale reactions from 250 microliters to 100 liters.  Note that all the curves line up, so at any scale these reactions happen at the same rate (produce the same amount of product per time).  This is another benefit of using cell-free reactions.